Developing a Simple Neural Network Model to Perform Binary Classification on Stroke Prediction
1. Introduction
As the begging we chose “stroke prediction”
as our project idea for the neural network model under the binary
classification. The stroke prediction neural network model is a significant
development in healthcare technology that helps to identify stroke risk early
and may even save lives.
A stroke is a serious medical illness that
develops when blood flow to the brain is suddenly interrupted, potentially
causing catastrophic repercussions including brain cell damage. In order to
avoid such occurrences and provide prompt medical assistance, early diagnosis
and prediction of stroke risk can be extremely important.
Artificial intelligence and machine
learning have produced encouraging results in a number of healthcare
applications, including stroke prediction. The likelihood of a person having a
stroke has been predicted using binary classification models, which divide
incidents into one of two categories (in this case, stroke or non-stroke).
A collection of machine learning models
known as neural networks takes its cues from the neural connections found in
the human brain. These models can capture detailed correlations between input
features and the intended outcome and are skilled at learning complex patterns
from vast datasets. The stroke prediction neural network model uses a set of
input features, such as age, gender, blood pressure, cholesterol levels,
smoking habits, and medical history, to predict whether a person is at risk of
stroke.
2. Data preparation
Any machine learning model, including a
neural network model for stroke prediction under binary classification, must
first be built, and data preparation is a key component of this process.
A labelled dataset with instances of
people who have had strokes and those who have not is fed into the model
training procedure. A precise mapping between the input information and the
binary stroke outcome is subsequently created by the neural network using the
data to train itself and optimise its internal parameters.
The dataset I chose to predict whether a
patient is likely to get stroke based on the input parameters like gender, age,
various diseases, and smoking status. Each row of the data provide pertinent
patient information.
2.1. Attribute Information of the selected dataset
id: Identification number of the
individual.
gender: Gender of the
individual,"Male", "Female" or "Other"
hypertension: Health related
parameter, does person have hypertension,0 if the patient doesn't have
hypertension, 1 if the patient has hypertension
heart_disease: Health related
parameter, does person have heart disease,0 if the patient doesn't have any
heart diseases, 1 if the patient has a heart disease
ever_married: Personal information, is
person married on not?
work_type: Nature of work
place,"children", "Govt_jov", "Never_worked",
"Private" or "Self-employed"
Residence_type: Residence type of the
individual,"Rural" or "Urban"
avg_glucose_level: average glucose
level in blood for the individual.
bmi: body mass index of the
individual.
smoking_status: Habitual information.
Current smoking status of individual,"formerly smoked", "never
smoked", "smokes" or "Unknown",1 if the patient had a
stroke or 0 if not
stroke: Our taget, is person suffered
heart attack?
Note: "Unknown" in
smoking_status means that the information is unavailable for this patient
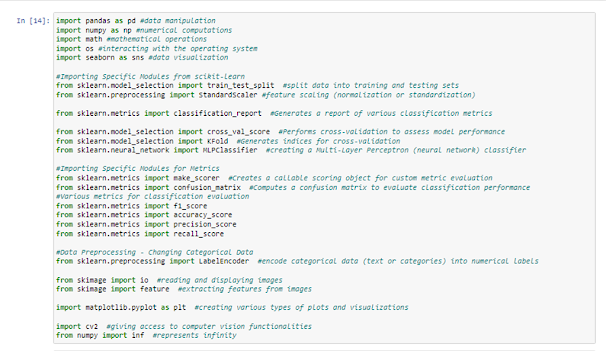
2.2. Import Libraries and Dataset
First we imported the necessary libraries and
the dataset.
Next, We have imported the dataset that we selected.
 We read the imported CSV file and stored it as a Pandas DataFrame in the variable "dataset". After reading the CSV file and storing it in the dataset DataFrame, you can see we have printed the shape of the dataset (dimensions), and displayed the first few rows of a dataset.
3. Data Pre-processing
Building a neural network model for stroke prediction under binary categorization requires careful data pre-processing. Pre-processing entails putting the raw data into a format that is appropriate for feeding into the neural network.
The code imports the "LabelEncoder" class from scikit-learn's preprocessing module. This class is used to encode categorical data (text or categories) into numerical labels.

3.1. Data visualization

3.2. Encoding the string columns


4. Model Design
Selecting a suitable architecture, defining the model's layers, activation functions, and other parameters are necessary to create a successful neural network model for stroke prediction under binary classification.
The output layer
consists of a single neuron representing the binary classification output
(stroke or no-stroke), and it is used a ReLu activation function on the
output neuron to squash the output into the range [0, 1], representing the
probability of a positive class (stroke) occurrence.

5. Hyperparameter Selection
Hyperparameter
selection in neural networks is the process of selecting values for various
parameters that are not learned during training. These hyperparameters regulate
the neural network's behaviour and have a big impact on how well it performs. The
process of selecting hyperparameters is always done through trial and error or
automated techniques like hyperparameter search algorithms.
Some
of the key hyperparameters in a neural network include learning rate, Number of
Layers, Number of Neurons per Layer, Activation Functions, etc..
In here, a Multi-Layer Perceptron (MLP) classifier is chosen as the machine learning method. The "MLPClassifier" class from scikit-learn's neural network module is used to create the model. The specific parameters used:
- solver='lbfgs': The optimization algorithm to train the MLP. 'lbfgs' is a quasi-Newton optimization method.
- alpha=1e-5: L2 : penalty (regularization term) for weight optimization.
- hidden_layer_sizes=(5, 2): The architecture of the neural network. It has two hidden layers with 5 and 2 neurons, respectively.
- random_state=1: Seed for random number generation, ensuring reproducibility.
ReLu is the Activation Function of the hidden layers. It is the default Activation Function in "MLPClassifier".
After creating the model, it's trained on the input features (x) and labels (y).

6. Overview of the Implementation Platform
For data science and machine learning projects, Anaconda Navigator with Jupyter Notebook is a common choice.
A graphical user interface (GUI) called Anaconda Navigator is included with the Anaconda distribution. It is a comprehensive Python distribution created exclusively for data science and machine learning. It comes with a sizable number of pre-installed tools and packages that make it simple to set up and maintain the data science environment.
In an interactive computing environment called Jupyter Notebook, you may create and share documents with live code, visualizations, and textual content. It is a well-liked tool for data visualisation, data analysis, and machine learning model development.
The main programming language employed by Anaconda Navigator and Jupyter Notebook is Python. It has a significant ecosystem of libraries and frameworks that are appropriate for machine learning and other data science tasks.
Essential Python libraries for data manipulation (e.g., Pandas), numerical computing (e.g., NumPy), data visualisation (e.g., Matplotlib, Seaborn), and machine learning (e.g., Scikit-learn, TensorFlow, PyTorch) are already pre-installed in Anaconda Navigator.
Deep learning tools like TensorFlow or PyTorch, which are popular in the data science community, can be used to create and train neural networks. These packages offer high-level abstractions for constructing intricate neural network designs and putting different optimisation techniques into practise.
Using Python libraries like Pandas, you may read and modify data in Jupyter Notebook. The Notebook itself can be used to carry out data preparation tasks like cleaning, feature engineering, and splitting into training, validation, and test sets.
TensorFlow or PyTorch can be used with Jupyter Notebook to define and train your neural network model. Code cells will be used to write the model's construction instructions, including information about the layers, activation functions, loss functions, and optimizers. Executing these code cells is required for training the model, which entails iteratively updating the model.
With Jupyter Notebook, we can use several plotting libraries like Matplotlib and Seaborn to visualise and analyse the data and model performance. This might assist us in understanding the data and assessing the performance of the trained neural network.
By changing the hyperparameter values in the model definition and analysing the effects on the model's performance on the validation set, we can perform hyperparameter tuning in Jupyter Notebook.
We can integrate code, visualisations, and explanatory text in a single document using Jupyter Notebook. Due to this, it serves as a excellent tool for project documentation and sharing with others for collaboration or presentation.
A user-friendly and interactive environment is offered by Anaconda Navigator with Jupyter Notebook for creating, testing, and deploying machine learning models like the stroke prediction neural network. It provides seamless tool and library integration, streamlining the data science workflow.
In here, we prepared the dataset as described in the previous response, including data cleaning, feature selection, normalization, and splitting into training, validation, and test sets.


Comparing the actual test labels with the predicted labels helps assess how well the model's predictions align with the ground truth and provides insights into the model's performance on unseen data.


8. Optimizing the hyper
parameters
This involves finding the best combination of hyperparameter values that result in the highest performance on the validation set.
This code trains an MLP classifier, performs cross-validation to evaluate its performance, and prints the evaluation metrics. Cross-validation helps assess how well the model generalizes to unseen data, and the printed metrics provide insights into the model's accuracy, precision, recall, and F1-score.

9. Final Optimized Model
In here, data should be clean, properly formatted, and preprocessed (e.g., handling missing values, encoding categorical variables, and scaling numerical features). The data should be split into training, validation, and test sets. Hyperparameters such as learning rate, number of layers, number of neurons per layer, dropout rate, and activation functions should be tuned to optimize the model's performance.
In here, this code uses the "matplotlib.pyplot" library to create a box plot visualization showing the performance metrics (accuracy, precision, recall, and f1) of an artificial neural network model. The plot includes various formatting options to enhance readability and presentation.


10. Test Results
It's crucial to assess the model's performance on a different test set that it hasn't seen before. As a result, the model is more likely to generalise to new data and can be more accurately estimated to perform well in practical applications.
In here, this code uses the "matplotlib.pyplot" library to create a line plot visualization that shows the performance metrics (accuracy, precision, recall, and f1-score) of an artificial neural network model across different cross-validation folds.


11. Discussion
The
aim of the neural network model for stroke prediction is to determine a
patient's risk of having a stroke based on a number of characteristics,
including age, gender, hypertension, heart disease, smoking status, and BMI. We
used a feedforward neural network, sometimes referred to as a multi-layer
perceptron (MLP), for this binary classification problem. As it was a binary
classification task, the architecture had an input layer, hidden layers, and an
output layer with a single neuron. We split the dataset into three sets:
training, validation, and test. The model was trained using the training set,
and its performance during training was monitored and overfitting was avoided
using the validation set. We used early stopping to avoid overfitting and
trained the model over a number of epochs.
12. References


Comments
Post a Comment